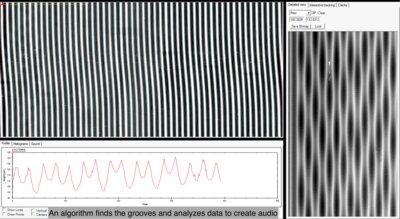
A view of a sample data set. A computer algorithm has created an image from the height data collected during the optical scan. The cylinder is displayed at the top left as if it has been opened up and flattened out. The height of the cylinder surface corresponds to the gray-scale value. Black is deepest and white is highest. The analysis software has also found the bottom of the groove and traced it in blue. Next the algorithm will look at the data along the blue lines, take the derivative between points to calculate the speed of the needle along that line and calculate the sound.
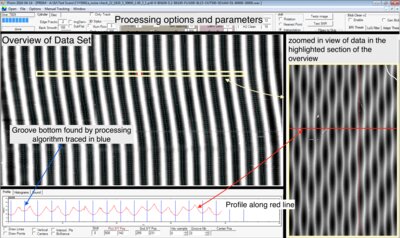
A View of the computer program used to read and display optical scans. The program shows an overview of a large data set which can be a small portion of a cylinder, or an entire cylinder and a detail of the cylinder surface. The software also displays a point by point profile of the data that was collected.