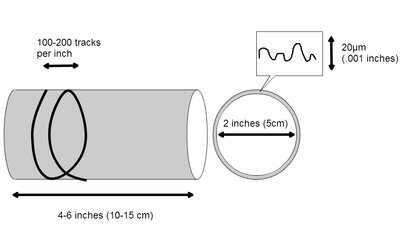
This diagram explains what a wax cylinder is. Typically, a cylinder is 4-6 inches (~10cm) tall and 2 inches(~4cm) in diameter. It is covered in a malleable wax that holds its shape but can be cut away or otherwise deformed by pressure. During recording a cutting stylus would cut a groove that winds around the exterior of the cylinder. The grooves are spaced with 100-200 grooves per inch and are around 20 μm deep. A μm, (pronounced micron) is one millionth of a meter. For reference, a human hair is typically around 50-100 μm thick. The cutter would bob up and down as it cut the groove with its speed dictated by the volume of the sound it was recording. The up and down motion of the cutter causes the groove to change in depth by 5-20 μm.
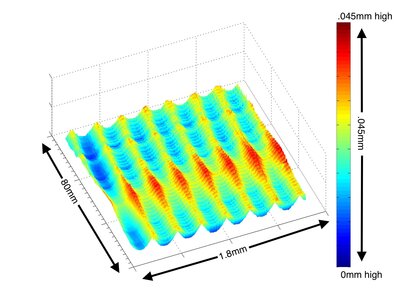
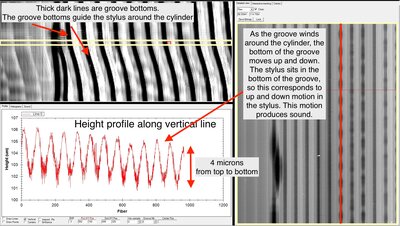
The image shows 7 grooves as if they were unwrapped from around the cylinder and flattened out. The changes in color correspond to changes in the height. The change in height would guide the needle to move up and down and it is that motion that produces sound. This image was made from stitching together 6000 height measurements of a 1.8 mm line on the cylinder as the cylinder rotated. It represents less than half a rotation around the cylinder.
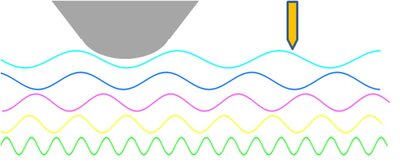
This Diagram schematizes the resolution limits of a hard stylus. The colored lines represent signals at different frequencies. They increase in frequency and decrease in wavelength as they move down the page. The stylus can only fit into and follow the light blue line, which has the smallest frequency and a wavelength equal to around twice the stylus's diameter. The stylus could not follow and resolve the other signals without attenuation. A method of reading the signals that had a smaller width, such as a light spot with a 10 micron diameter, like the light points measured by the optical probe, can fit into and resolve much smaller higher frequency, more tightly spaced signals.
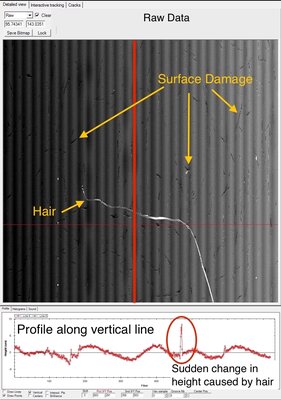
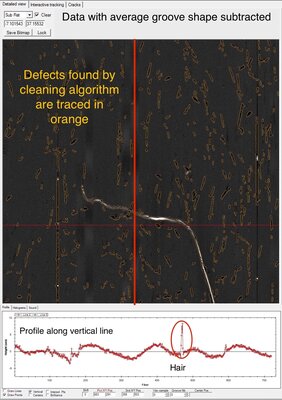
A sample of Raw data with defects that can cause unwanted noise. The white line is some feature sitting on top of the surface, most likely a hair or other fiber. Its edges are very sharp, causing high frequency changes in the height of the surface, which will introduce a high frequency noise into the audio, a sharp clicking noise every time a stylus intersects it.
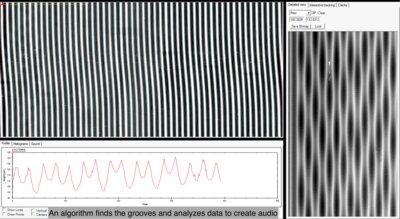
This diagram explains how audio is encoded in IRENE images. The images produced from optical scan images are depth images, where gray-scale value in the image correspond to height of the surface, white is highest and black is deepest. This image shows that if one follows a groove around the cylinder the bottom of the groove undulates up and down, in and out of the cylinder surface. This undulation was engraved into the cylinder surface by the recording stylus and induces the motion in a playback stylus that would produce audio. The speed of the stylus directly relates to sound and so to produce audio all that is necessary is to find the data along the groove bottom, which is done using a processing algorithm, and take the derivative along the bottom.
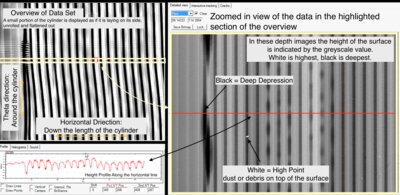
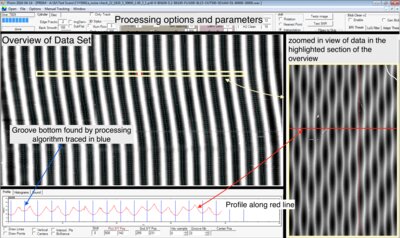
The data taken during an optical scan is stitched together and displayed by a computer program. The program shows an overview of a large data set which can be a small portion of a cylinder, or an entire cylinder, and zoomed in view of the portion of the cylinder in the yellow rectangle. The software also displays a point by point profile of the data. Position on the vertical axis of the image corresponds to position in the rotational direction, around the circumference of the cylinder. Position on the horizontal axis of the image corresponds to position along the length of the cylinder and the grey scale value of the image corresponds to the height of the surface. White is highest on the surface and black is deepest into the surface. Displaying data in this way makes it easy to run image processing algorithms like edge finding and blob detection that enable producing sound and reducing the effect of blemishes.
A sample of data with defects that can cause unwanted noise. An algorithm has analyzed the image and found effects whose boundaries are too steep to be actual audio content. It has circled them in orange and in the next step of the process will blur their edges with surrounding pixels to reduce the effect they have on the audio from in that part of the cylinder.
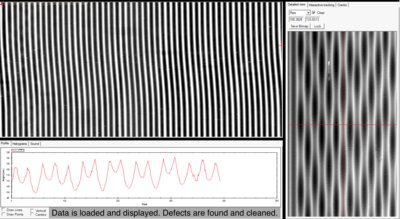
The first step of creating sound from an optical scan is loading in and displaying the data taken during scans. A piece of software loads that data in and generates the images shown here. The images are three dimensional, depth images where grey-scale values correspond to the height of the surface. The software allows the user to look at the data point by point (bottom left) in detail (right ) and all at once (top left).
A view of a sample data set. A computer algorithm has created an image from the height data collected during the optical scan. The cylinder is displayed at the top left as if it has been opened up and flattened out. The height of the cylinder surface corresponds to the gray-scale value. Black is deepest and white is highest. The analysis software has also found the bottom of the groove and traced it in blue. Next the algorithm will look at the data along the blue lines, take the derivative between points to calculate the speed of the needle along that line and calculate the sound.
A View of the computer program used to read and display optical scans. The program shows an overview of a large data set which can be a small portion of a cylinder, or an entire cylinder and a detail of the cylinder surface. The software also displays a point by point profile of the data that was collected.