Toggle navigation
We're Here, We're Queer, and We're in the Public Record! - Spotlight exhibits at the UC Berkeley Library
Bookmarks (
0
)
History
Sign in
Feedback
Contact Us
Name
Ignore this text box. It is used to detect spammers. If you enter anything into this text box, your message will not be sent.
Email
Message
Cancel
We're Here, We're Queer, and We're in the Public Record!
The LGBTQ Movement and Life as Seen Through Government Information
Home
Themes
Arts
Education
Employment
Family & Community
Health
Immigration
Military
Political Pride
Terminology
About
search for
Search
Home
Search Results
Toggle facets
Limit your search
Exhibit Tags
HIV/AIDS
[remove]
2
cdc
[remove]
2
charts and graphs
[remove]
2
united states
2
Search Constraints
Start Over
You searched for:
Exhibit Tags
charts and graphs
Remove constraint Exhibit Tags: charts and graphs
Exhibit Tags
cdc
Remove constraint Exhibit Tags: cdc
Exhibit Tags
HIV/AIDS
Remove constraint Exhibit Tags: HIV/AIDS
1
-
2
of
2
Number of results to display per page
10 per page
50
per page
10
per page
20
per page
100
per page
View results as:
List
Gallery
Masonry
Slideshow
Search Results
1.
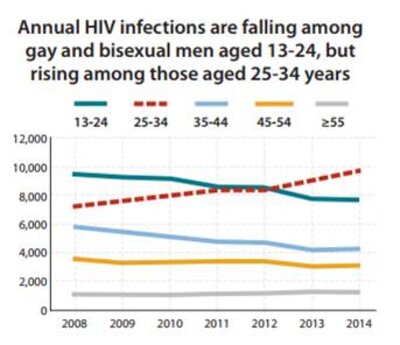
Annual HIV infections by age in the U.S., CDC 2016
Description:
Line graph from the CDC titled, "Annual HIV infections are falling among gay and bisexual men aged 13-24, but rising among those aged 25-34 years".
Attribution:
CDC, Diagnoses of HIV Infection in the United States and dependent areas, 2016. HIV Surveillance Report, 2017.
2.
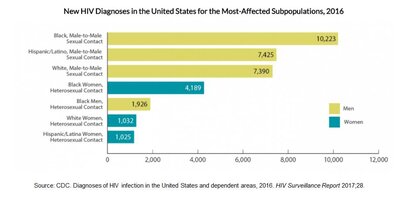
New HIV Diagnoses in the U.S., CDC 2016
Description:
Bar chart of New HIV Diagnoses in the United States for the Most-Affected Subpopulations, 2016. Source: CDC, Diagnoses of HIV Infection in the United States and dependent areas, 2016. HIV Surveillance Report 2017, 28.